PRTG Manual: Remote Probes and Multiple Probes
Upon installation, PRTG creates the first probe automatically, called the Local Probe. It runs on the same machine as the PRTG core server and monitors all devices from this system, using the sensors you have configured. Working with only one local probe should suffice for Local Area Network (LAN) monitoring and if you want to monitor one location only.
Scenarios Requiring Remote Probes
However, there are several situations making it necessary to work with Remote Probes in the same LAN or in remote locations. Among these situations are the following:
- You have more than one location and you need to make sure that services are available from all locations.
- Your network is separated in several LANs by firewalls, and the local probe cannot monitor specific services across the firewalls.
- You need to monitor systems in a Virtual Private Network (VPN) across public or in-secure data lines.
- You want to sniff packets on another computer.
- You want to monitor NetFlow data on another computer.
- You experience performance issues with CPU intensive sensors like packet sniffer or NetFlow sensors and need to distribute the load over more than one PC.
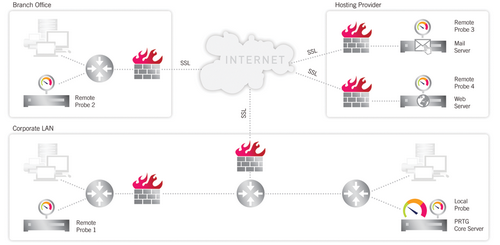
The following chart shows an example for a remote probe scenario.

Monitoring a Distrubuted Network with PRTG (Illustration Also Available as Video Tutorial)
The PRTG core server inside the Corporate LAN (bottom right) is able to monitor:
- Services inside the Corporate LAN using the Local Probe.
- Services behind a firewall in the Corporate LAN using Remote Probe 1.
- Secured services inside the Branch Office (top left) using Remote Probe 2.
- Secured services on Mail Server and Web Server using Remote Probe 3 and Remote Probe 4 installed directly on these servers.
- Public services on the internet using any of the probes.
As soon as a probe is started, it automatically connects to its core server, downloads the sensor configuration, and begins its monitoring tasks. The core server sends new configuration data to a probe as soon as the monitoring configuration is changed by the user. Probes monitor autonomously and send the monitoring results back to the core server for each check they have performed.
If the connections between core and probe fails for any reason (for example, a reboot of the computer running the core server) the probe continues its monitoring and stores the results. During a connection loss a buffer stores a maximum of 500,000 sensor results in RAM memory of the remote probe system (up to 50 - 200 MB). This means that for 100 sensors with one minute interval the monitoring results of up to 3 days can be buffered (or 52 minutes for 10,000 sensors with one minute interval). The probe automatically reconnects to the core as soon as it is available again and transmits all monitoring results gathered during the connection loss.
The connection between probe and core is initiated by the probe, secured using Secure Sockets Layer (SSL). This means that the data sent back and forth between core and probe is not visible to someone capturing data packets. The core server provides an open TCP/IP port and waits for connection attempts from probes. If a new probe connects for the first time, the administrator will receive a ToDo ticket and will then see the new probe in the device tree.
As a security precaution, the probe must be manually acknowledged by the administrator in the device tree before any sensors can be created and monitored. The administrator can also deny a probe which will then be disconnected. No further connection attempts will be accepted and the probe IP is added to the Deny IPs list in the probes system settings (see System Administration—Probes section). This ensures that unauthorized probes cannot connect to a core server.
Because the probe initiates the connection, you must ensure that a connection can be established from the outside world onto your core server. For example, you may need to open any necessary ports in your firewall and you may need to specify a Network Address Translation (NAT) rule for your network. The process is the same as if you wanted to allow access to the web server provided by the PRTG core server via port 443, for example. Usually it is sufficient to open or forward TCP port 23560 (default) on the machine that runs the core server; on probe side it is not necessary to open any port in most cases.
Whenever a new version of PRTG is installed on the core server, all remote probes will automatically download and install the updated version of the probe as soon as they reconnect to the updated core installation.
The local probe has already been updated during the core installation. All remote probes are automatically downloading the new binaries using the SSL-secured probe/core connection. The download of the 4 MB file takes between a few seconds (in a LAN) and a few minutes (via internet connections), depending on the available bandwidth. As soon as the update has been downloaded the probe disconnects, installs the update and reconnects to the core server. This takes between 20 and 100 seconds. Please note that during the update phase the monitoring of the local probe can be affected due to the bandwidth required for the downloads.
Video Tutorial: There is a video available on the Paessler video tutorials page.
Keywords: