PRTG Manual: Maps
The Enterprise Console has a tab-like interface. Using the tabs you can navigate through various pages with information about your monitored objects, such as your network's status, monitoring results, etc., as well as access maps, reports, and settings.
Enterprise Console Menu Tabs Bar
There is documentation available for the following tabs:
The page is split into two parts. On the left hand side you see all available maps from one or several servers, on the right hand side the actual maps are displayed.
- Single-click on a map's name to display it. In the tabs above the map, select from View Map, Maps Designer, Settings, Get HTML, and Comments. Each of these tabs loads the respective functionality of the Ajax Web Interface. Please remember to click the Save button in order to apply your settings. Please find detailed information in the Maps section.
- Double-click on a map's name to open the map in the configured external web browser. You can edit it using the Maps Designer, or add new maps on this PRTG server. For more information see Maps section.
- Right-click on a map's name to open a context menu. The following options are available: Add, Edit, Delete, Clone, Open in Web Browser.
Click on the Add Map button to add a new map to a core server.
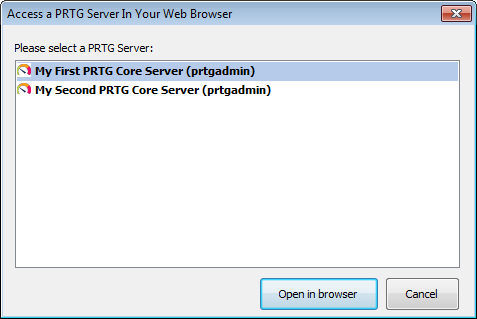
Depending on the current setting shown in the server selection bar in the upper right corner, an (embedded) window will be opened immediately (if one specific server is selected), or you will be prompted with a selection window, asking you to choose the core server you want to add the new item to. Choose an installation to start.

Enterprise Console Server Selection Dialog
For details about adding a map, please see Maps Step By Step.
Keywords: