PRTG Manual: Alarms
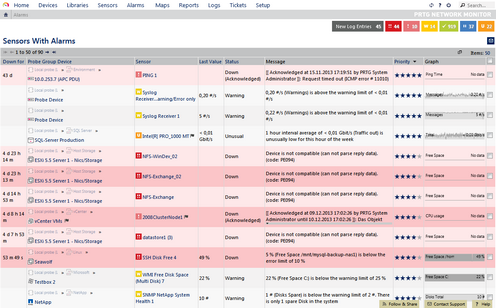
The Alarm list shows all sensors that are currently in a Down, Down (Partial), Down (Acknowledged), Warning, or Unusual status. Sensors in other states (for example, Up, Paused, or Unknown) do not appear here. This is useful to keep track of all irregularities in your network.
In the table list, you can re-sort the items by clicking on the column's header items.

Alarms List
There are two possibilities to call the alarms list: Either you click on the Alarms tab on the detail page of a probe, group, or device (not available for sensors), or you choose the Alarms entry in the main menu.
Pages of probes, groups, device, and sensors have a tab-like interface. Using the tabs you can navigate through various sub-pages of an object in order to show your network's status, view monitoring results, or change settings.
Tabs Bar on Group and Probe Level
On an object's detail view, click on the Alarms tab to show a table list of all sensors on this object that currently show a Down, Down (Partial), Warning, or Unusual status. You will see a subset of sensors in an alarm state for the current object only. This is a subset of the entries available via the Alarms | All option in main menu. The tab is not available on a sensor's detail page.
Click the Alarms entry from the main menu to show a table list of all sensors in your configuration that currently show a Down, Down (Partial), Down (Acknowledged), Warning, or Unusual status. You can also show these sensors as gauges. Hover the Alarms entry and select another option to only show a subset of sensors in certain states. Choose between:
- All
Shows a list of all sensors which currently show a Down, Down (Partial), Down (Acknowledged), Warning, or Unusual status. - Show as Gauges
Shows the gauges of all sensors which currently show a Down, Down (Partial), Down (Acknowledged), Warning, or Unusual status. The size of the sensor gauges corresponds to their respective priority. - Errors Only
Shows a list of all sensors which currently show a Down, Down (Partial), or Down (Acknowledged) status. - Warnings Only
Shows a list of all sensors which currently show a Warning status. - Unusuals Only
Shows a list of all sensors which currently show an Unusual status.
An acknowledged alarm will show up in the alarms list as "acknowledged" (see Sensor States) and will not trigger any more notifications. Note: If the alarm condition clears, the sensor will usually return into an Up status immediately with the next sensor scan.
In order to acknowledge an alarm, right-click on a sensor and choose Acknowledge Alarm... from the context menu, enter a message and click the OK button. The message will appear in the sensor's last message value. You can choose between: Acknowledge Indefinitely..., acknowledge For 5 Minutes..., For 15 Minutes..., For 1 Hour..., For 3 Hours..., For 1 Day..., or Until....
If you choose Until... a popup window will appear:
Acknowledge Alarm until |
|
|---|---|
Selected Objects |
Shows the sensor(s) for which you want to acknowledge the alarm. You can acknowledge alarms for more than one sensor using multi-edit. |
Message |
Enter a text, for example, the reason why you acknowledge the alarm. |
Until |
Enter the date when the acknowledge status will end. Use the date time picker to enter the date and time. Note: If the alarm condition still persists after the specified date, the sensor will show a Down status again. |
Only users with write access rights may acknowledge alarms. Read-only users can be given the right to acknowledge alarms, too. See section User Accounts Settings, section Account Control.
Knowledge Base: Which audible notifications are available in PRTG? Can I change the default sound?
Ajax Web Interface—Basic Procedures—Topics
Other Ajax Web Interface Sections
Related Topics |
|---|
Keywords: